Want statistics on your site visitors without the confusion of Google Analytics?
Broadstreet’s Flux Analytics provides a quick and visually friendly way to see how pages on your site are doing for traffic and engagement.
In this article we’ll go over the basics of Flux Analytics:
- Locate Web Analytics
- Set Up Flux Analytics
- Running a Report
- Understanding Flux Analytics
- Download Analytics
Locate Flux Analytics
Navigate to the Flux Analytics option in the left menu.
Set Up Flux Analytics
The Website Analytics page will open. The first thing you’ll see is the snippet of code that needs to be placed inside your website’s <head> element. This should look something like:
<script src="https://flux.broadstreet.ai/emit/8299.js" async></script>Note, if using WordPress, you can enable Flux Analytics through Broadstreet’s plugin rather than placing the header code.
Running A Report
The first look of your Flux Analytics shows a report that defaults to your overall site data.
To see information about a specific page, copy the webpage URL you want statistics for and paste the link in the search bar .
You can filter the data you see by date. Click the date range to the right of the search bar. In the dropdown, select one of the time periods to filter by.
You can also click Custom Range to select a specific date range with a calendar. Click Apply when you’re done.
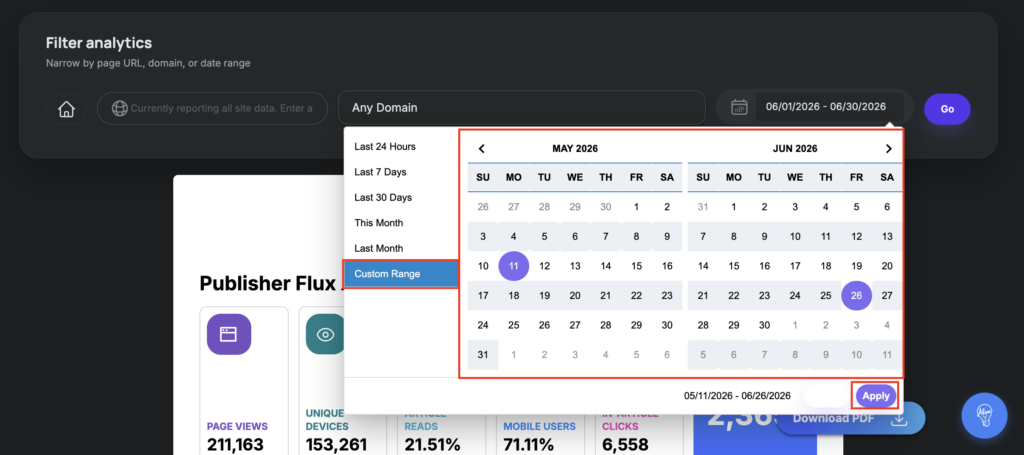
When you’re ready, click Go and see the analytics.
Understanding Flux Analytics
There are several sections of analytics. We’ll briefly go over each below:
- Page Views – Number of times the page has been opened to view.
- Unique Devices – Number of unique device visits to the page.
- Complete Article Reads – Percentage of times the entire article is scrolled through based on the article length.
- Total Ad Clicks – Number of ads clicked on the page.
- Mobile Users – Percentage of users on your site using a mobile device.
- Top Cities – A list of cities most of your page views are coming from.
- Top Pages – A list of the most popular pages by page view. If you see a “/” in the list, that signifies your website homepage.
- Top Referrers – A list of where your page views are coming from on the web.
- Mobile Users – Percentage of page views from users on a mobile device.
- In-Article Clicks – Number of link clicks within an article.
- Traffic With Ad Blockers Detected – Percentage of users who had an adblocker installed.
- Bot Views Prevented – Number of bots detected on your site that were removed from your reporting
- Traffic That Bypassed Ad Blockers – Only for networks who have our Whitelabeling enabled! Percentage of users with ad blockers enabled, but served an ad despite the ad blocker.
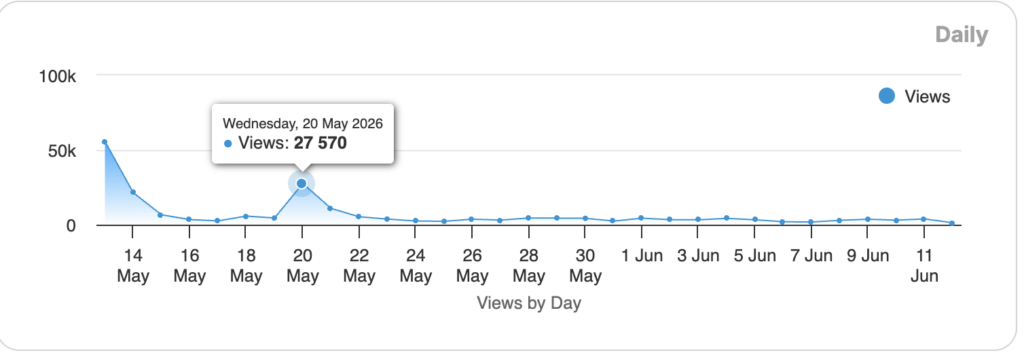
There is also a graph that displays the page views of the selected URL. The x-axis of the graph will automatically adjust based on the date range selected. You can click one of the blue dots for more details on the graph.
Download Analytics
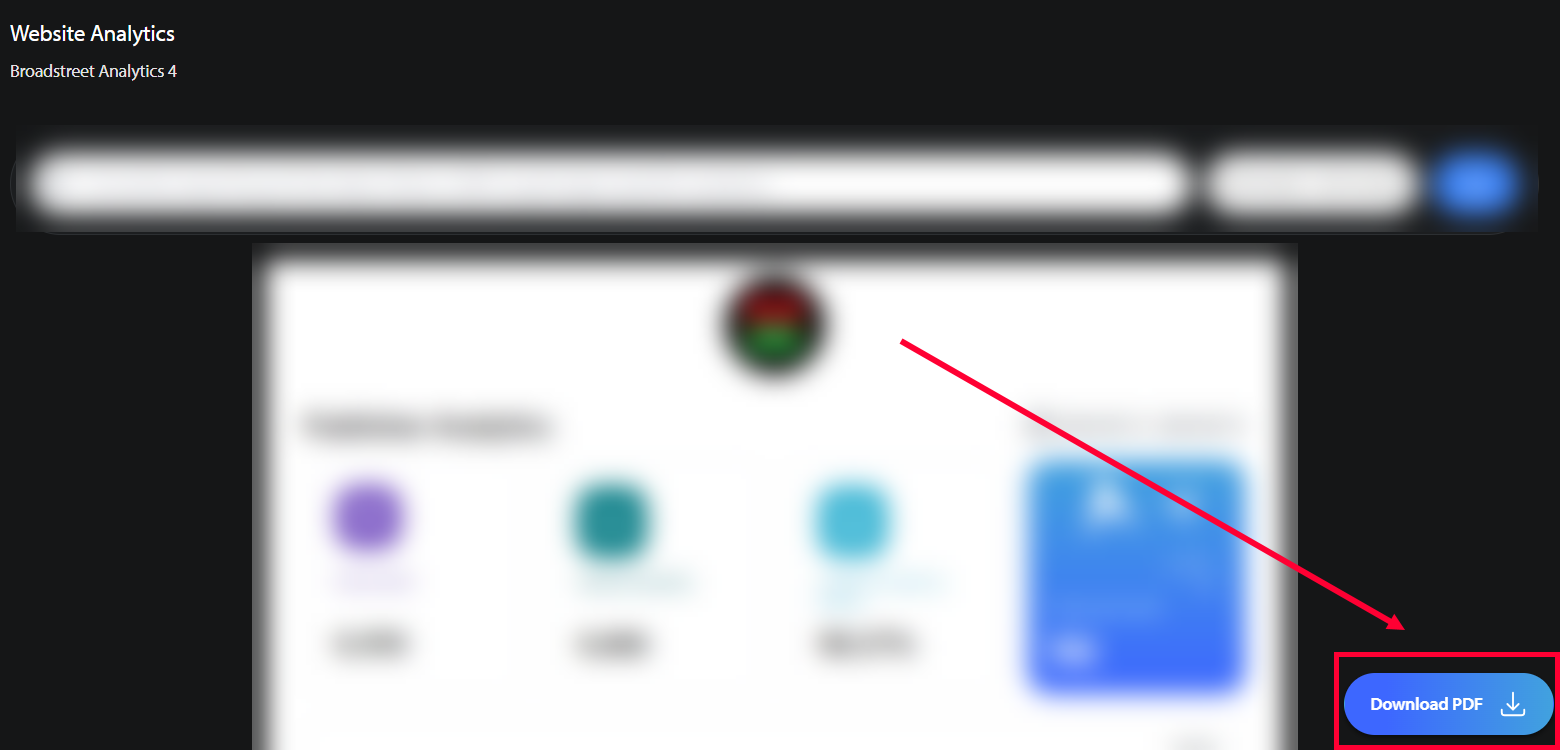
To download a PDF version of your site analytics, click Download PDF in the bottom right corner. Make sure you’ve entered the correct URL and set the desired date range before you export your report.
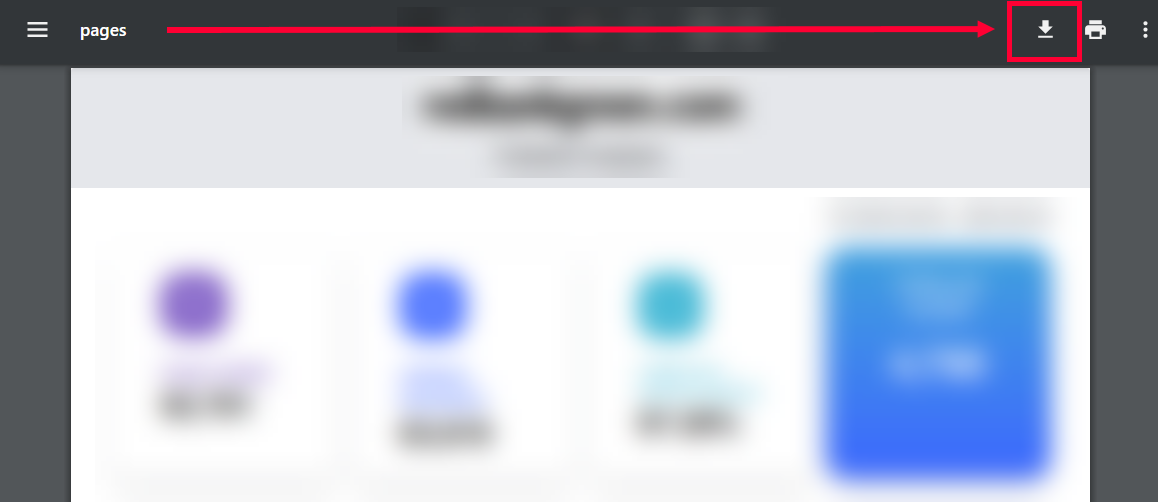
The PDF version of the report will open on your screen. Click the down arrow in the top right to save a copy to your device.